Bureau of Labor Statistics:12 Stats about Working Women https://www.bls.gov/blog/2017/12-stats-about-working-women.htm 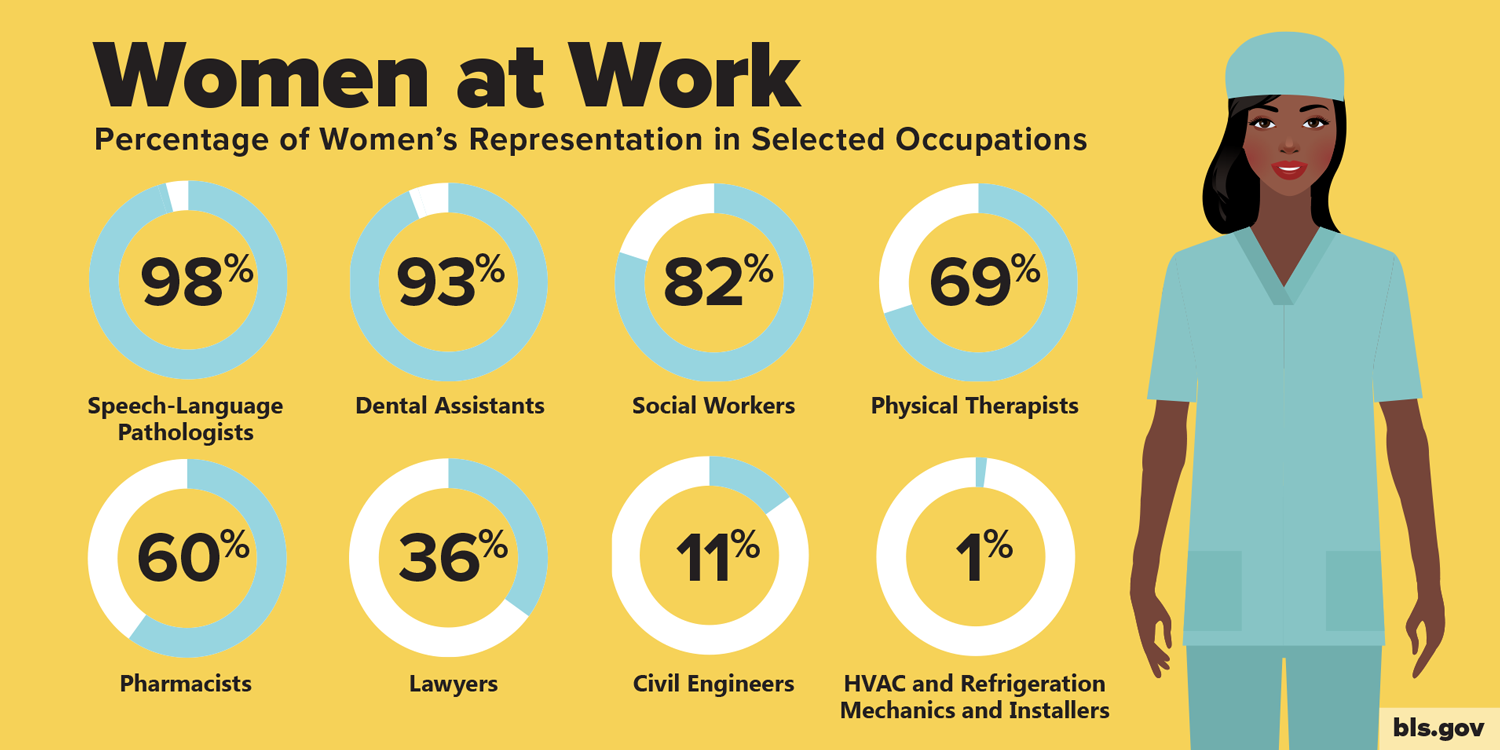
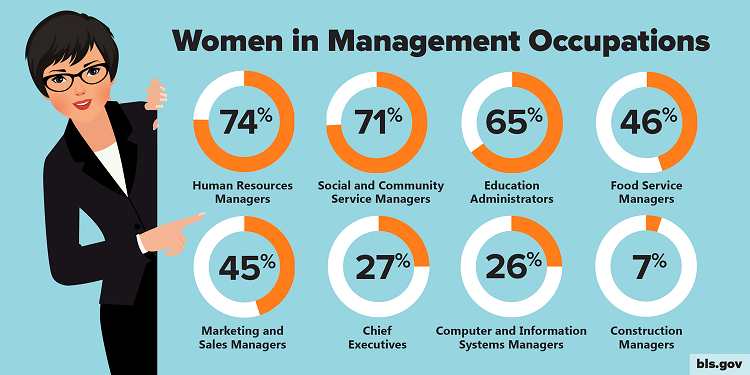
Women at Work: Percentage of Women’s Representation in Selected Occupations | Speech-language pathologists | 98% | | Dental assistants | 93% | | Social workers | 82% | | Physical therapists | 69% | | Pharmacists | 60% | | Lawyers | 36% | | Civil engineers | 11% | | HVAC and refrigeration mechanics and installers | 1% | Women in Management Occupations | Human resources managers | 74% | | Social and community service managers | 71% | | Education administrators | 65% | | Food service managers | 46% | | Marketing and sales managers | 45% | | Chief executives | 27% | | Computer and information systems managers | 26% | | Construction managers | 7% | |